Solar energy impacts on migratory birds
Renewable energy production and the associated decrease of carbon dioxide emissions is likely to reduce the impacts of climate change, a critical threat to human and wildlife populations alike. The development of new alternative energy infrastructure is expected to increase in the years to come, with a large proportion of this growth dedicated to solar energy production. Given this rapid expansion of utility-scale solar energy, it is important to quantify and understand the dynamics of the impacts of solar facilities on avian populations in order to better plan and mitigate the potential impacts of future utility-scale solar infrastructures.
Problem:
Avian samples collected at solar facilities themselves are the key to understanding this dynamic. However, some samples collected at facilities may be affected by a variety of other phenomena, including degradation, predation, or scavenging by other animals, and the quality of observed “feather spots” can greatly vary. In fact, over 30% of avian samples may be unidentifiable in the field, leading to a significant loss of data that could otherwise add to our understanding of how species and populations are impacted by solar facilities.
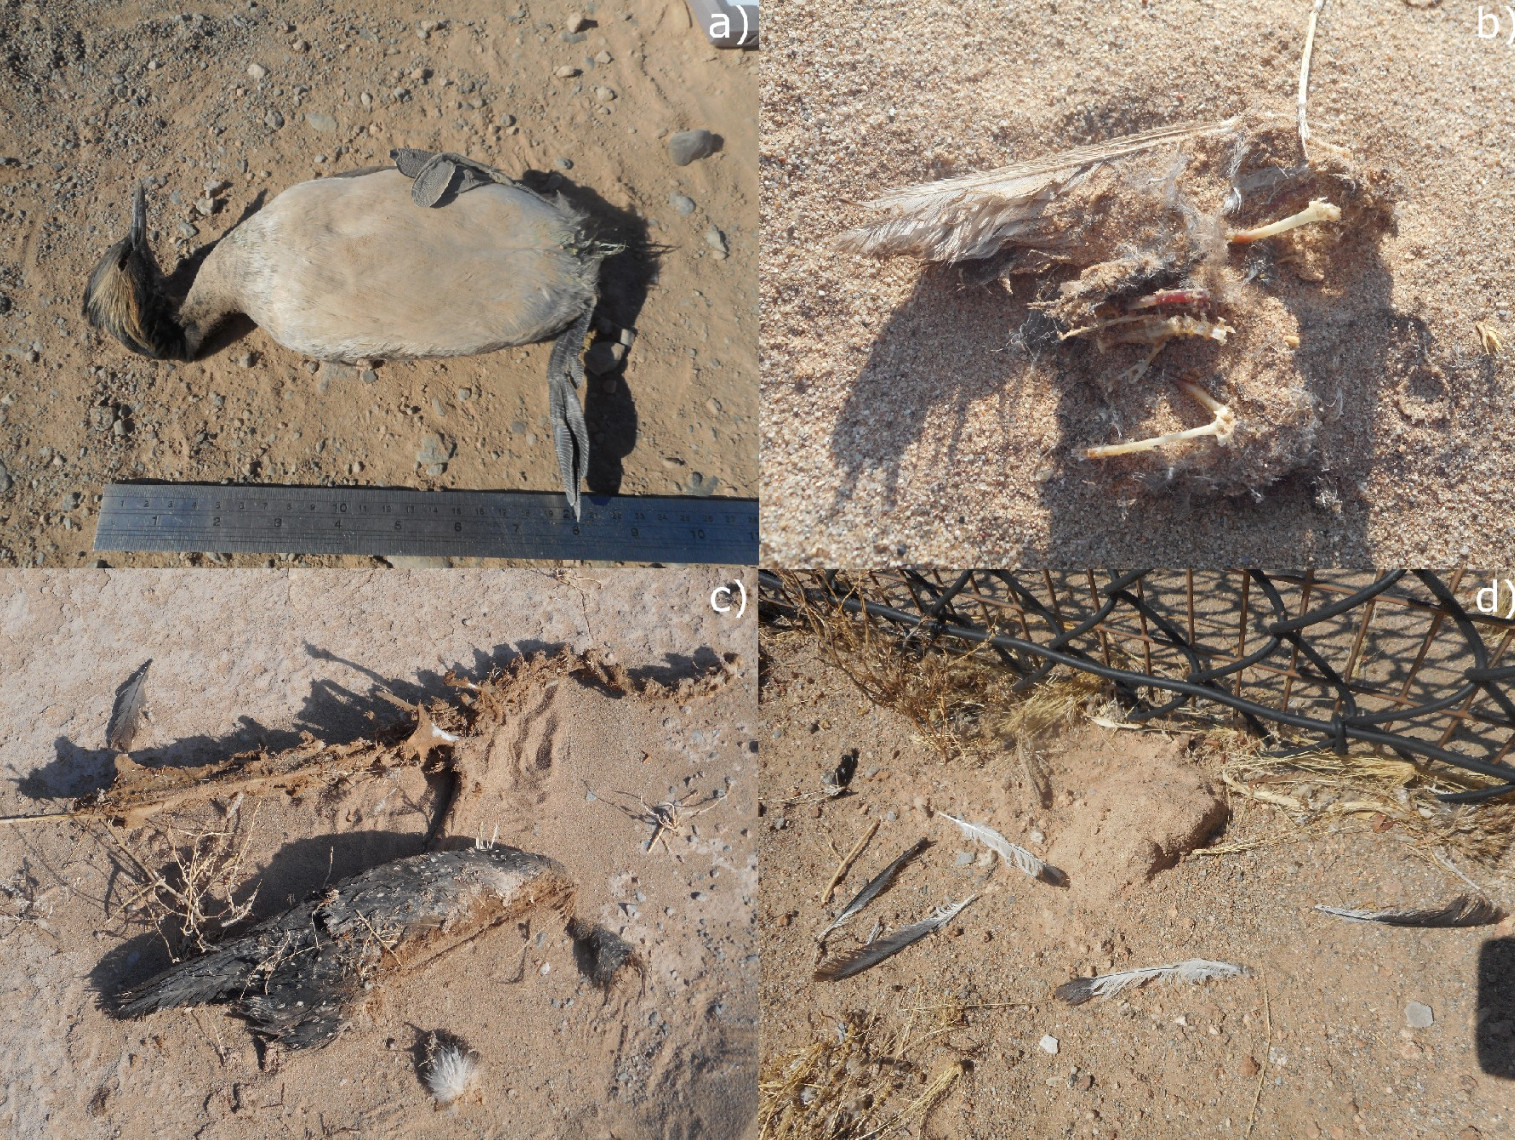
Examples of an intact carcass (a), partial carcasses (b,c), and feather spot (d). Sourced from Kosciuch et al. 2020.
Solution:
We have developed a rapid, cost-effective DNA-based approach to identify samples that can be utilized in parallel with morphology-based identification of samples in the field. This new pipeline increases our knowledge of patterns of avian interactions at solar facilities. In short, we extract DNA from morphologically unidentifiable samples for identification by molecular means. See the molecular pipeline below to better understand this workflow:
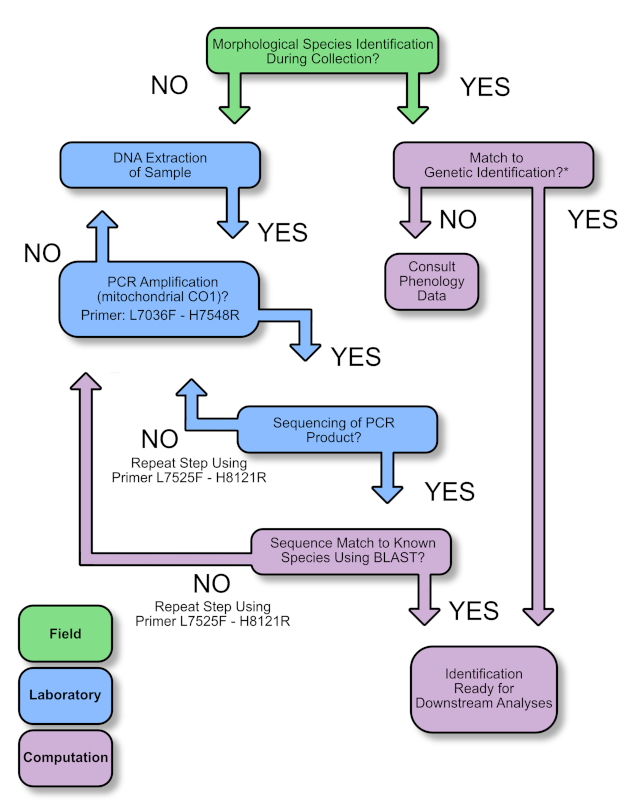
Molecular identification pipeline for samples of unknown origin. For more details about the pipeline, see Gruppi et al. 2023 (see below).
Outcome:
From 2014-2021, around 18% of avian samples found at solar sites were unidentifiable to species in the field by their morphology. Using the pipeline above, we successfully identified over 93% of these previously unidentifiable samples to the species level. In other words, we were able to successfully identify almost all avian samples that were found at solar sites, regardless of their physical condition. This gives us much greater resolution when examining the dynamics of impacts between migratory birds and solar sites. Pretty cool and highly valuable!
Application:
As we’re able to access more usable data with our molecular pipeline, we begin to better understand which species groups are most impacted by solar sites.
For instance, the figure to the right shows that when we incorporate genetically identified samples to our data set, we see changes in the proportions of impacted species groups compared to those we find with morphological identification alone.
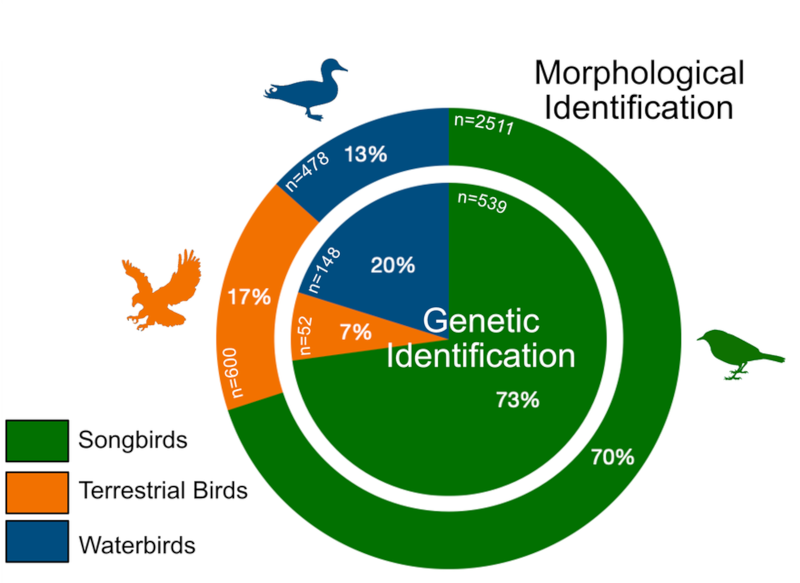
Incorporating genetically identified samples significantly changes the proportions of impacted species groups (x2 = 57.96, n = 4,328, p < 0.00001).
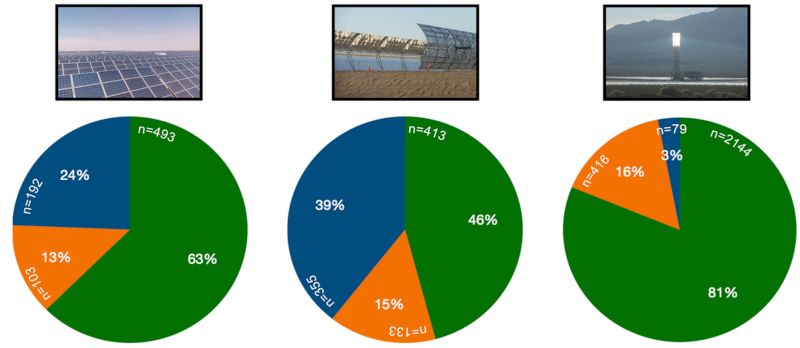
Species groups impacted differently across solar technologies: a) photovoltaic, b) solar trough, and c) power tower (x2 = 811.84, n = 4,328, p < 0.00001).
We also have greater resolution to understand how various solar site types differentially impact species groups.
Using our molecular identification pipeline, we identified species otherwise not previously identified as impacted:
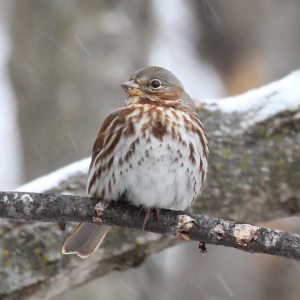
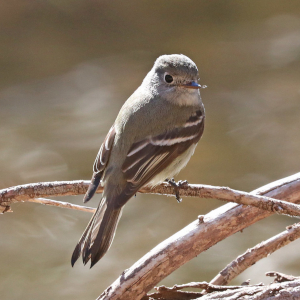
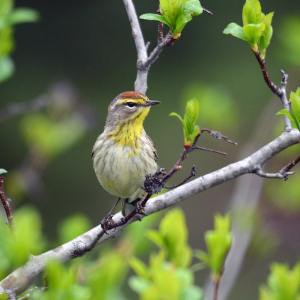
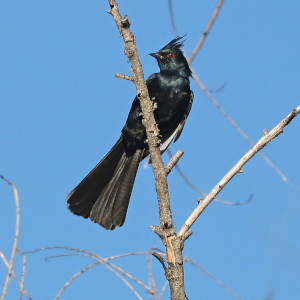
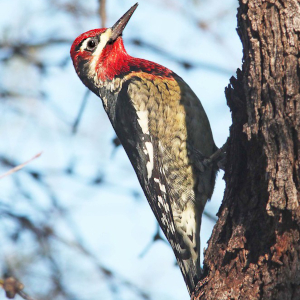
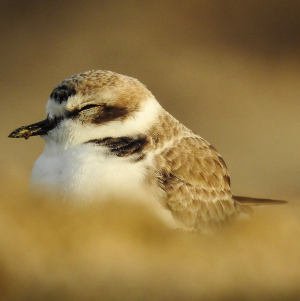
Species left to right: Fox Sparrow, Hammond’s Flycatcher, Palm Warbler, Phainopepla, Red-naped Sapsucker, and Snowy Plover.
Bird Genoscape Project Integration:
By utilizing as many of the samples collected at solar sites, we can also look at how populations of species are differentially impacted using our genoscapes. For example, the figure below breaks down impacts to genetically distinct populations of Wilson’s Warbler at different solar sites across California. The California Coastal (yellow) and Basin Rockies (orange) populations are declining and considered highly vulnerable (Ruegg et al. 2020), but so far we’ve only seen impacts to the Coastal California population (panel B below) by solar sites in the southwest United States. This level of clarity is critical if we want to mitigate losses to especially vulnerable migratory bird populations!
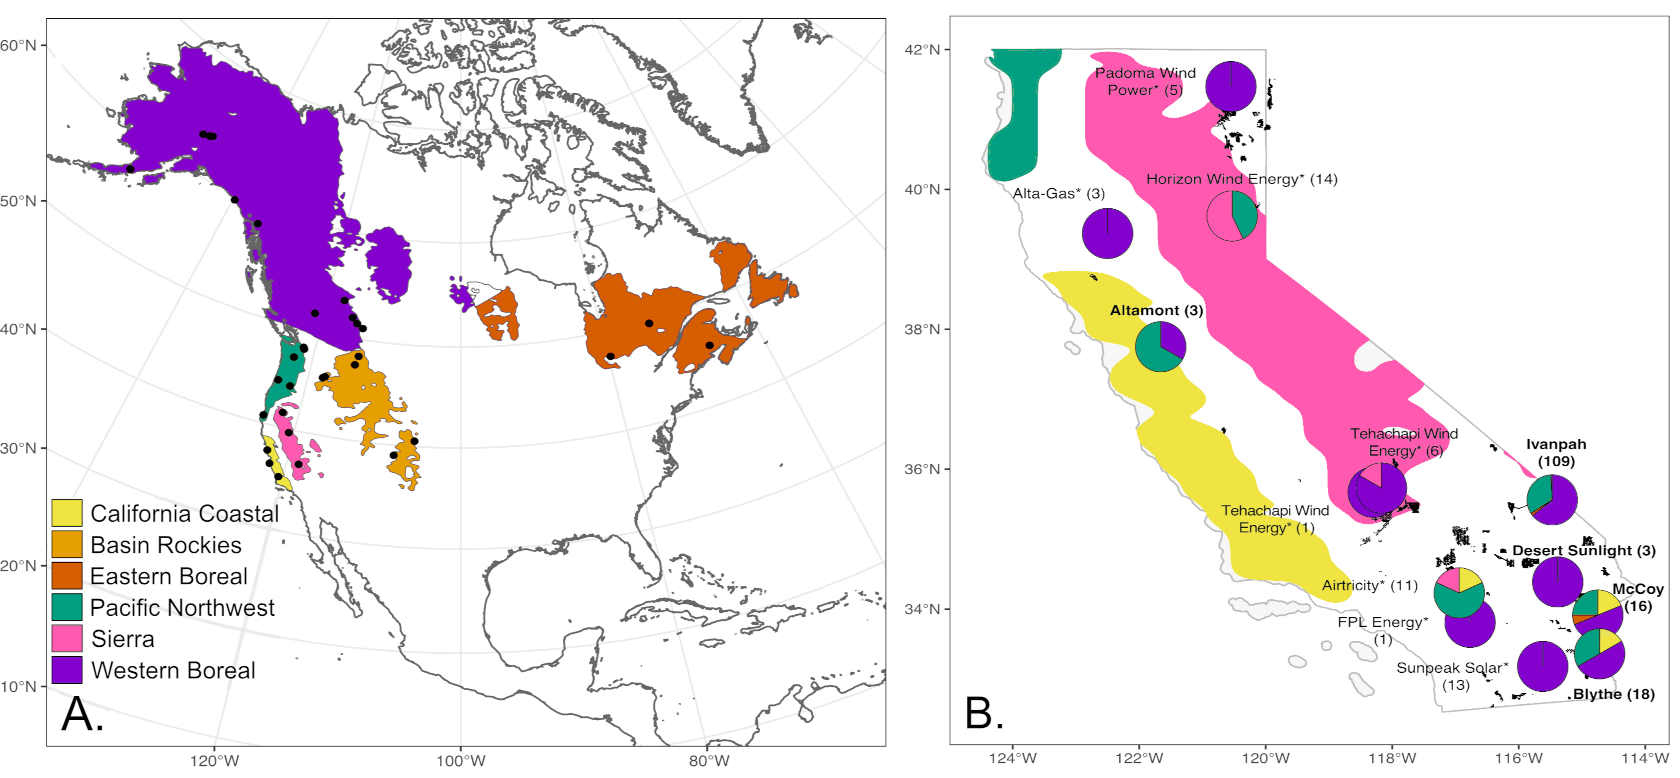
Panel (A) depicts the genoscape for Wilson’s Warbler, with six genetically distinct populations and panel (B) looks at the impacts different solar and wind energy sites in California have on those genetically distinct populations. Black dots in panel (A) represent sampling locations where we collected Wilson’s Warbler DNA samples to build the genoscape. Numbers in parentheses in panel (B) represent the number of impacted Wilson’s Warblers at a particular site.
How the Application can Inform and Impact Conservation Efforts:
Finally, this work can help to inform our conservation strategies by providing critical information to both planning and industry leaders. By identifying regions and populations of birds (across many species!) that are impacted by solar industry activities, we can help to shape both mitigation and siting plans. For example, lands may be prioritized for mitigation (purchasing of critical habitat as offset for development elsewhere) when bird populations there are at relatively low risk from development. Alternatively, lands may be excluded from siting (the purchase of land for development) if bird populations there are particularly vulnerable. The more data we can collect, the better our understanding of these dynamic populations, and the more informed our future conservation efforts will be.
Project Publications:
Gruppi C, Sanzenbacher P, Balekjian K, Hagar R, Hagen S, et al. (2023) Genetic identification of avian samples recovered from solar energy installations. PLOS ONE 18(9): e0289949.
Harrigan RJ, Rajbhandary J, Bossu C, Sanzenbacher P, Dietsch T, et al. (2023) Utilizing high-resolution genetic markers to track population-level exposure of migratory birds to renewable energy development. PLOS Sustainability and Transformation 2(12): eooooo88.
Up-to-date Solar Samples Map
The map below shows where we have collected samples at solar sites across regions to date (please wait a minute for it to appear as it is being updated in near real-time as data is processed)! If you know of any groups working at renewable energy facilities, or collecting similar data, get in touch with us, as we would like as much data as possible to be included in our recommendations to decision-makers. As you can see from our map, there is much work still to be done!
Pie charts represent the regions where feather spot data has been collected and identified, and are split into three broad categories – Songbirds (green), Terrestrial Birds (yellow), and Waterbirds (blue). If you click on a piechart, you can see the percentage of each of these groups recovered from that region. Lighter background colors mark the major Bird Conservation Regions of North America (Source: NABCI). Piecharts with a “???” indicate that while feather spots have been collected in these regions, more data are needed to properly estimate percentages of the groups being impacted by energy facilities.
The following groups have come together to make this work possible:

